Proper Management of Logs in .Net
Introduction
 Often, recording events of an application is forgotten due to a lack of fast
and efficient recording methods. In this article we will see what . NET
framework puts at our disposal in order to log your application. Often, recording events of an application is forgotten due to a lack of fast
and efficient recording methods. In this article we will see what . NET
framework puts at our disposal in order to log your application.
We know all the famous log files of applications such as Apache. But what we
don’t do generally is to log our own application. It is a mistake that can cost
you dearly in wasted time. Not to mention the fact that you will lose the
ability to have a clear explanation of the problem for your users when they will
call you for help. We will see what means are available to the programmer to
easily manage logs of its application and how to use them.
In Search of a Bug
 The last step before deploying an application is the seeking of a bug in the
application. To do this it may be helpful to have an output events and state of
variables or connections in a file easily readable. But this valuable
information is so useful to the developer and not useful to the user, even will
tending to scare him. Moreover, everyone knows that writing in a file or console
output is a long operation, resulting in a loss of performance of the
application. However, there is no question to write code for debugging and then
remove it before recompiling application in "Release". So how do you reconcile
the two? This is where the framework intervenes by providing us constant DEBUG
compilation and manipulation classes of debugging information. The last step before deploying an application is the seeking of a bug in the
application. To do this it may be helpful to have an output events and state of
variables or connections in a file easily readable. But this valuable
information is so useful to the developer and not useful to the user, even will
tending to scare him. Moreover, everyone knows that writing in a file or console
output is a long operation, resulting in a loss of performance of the
application. However, there is no question to write code for debugging and then
remove it before recompiling application in "Release". So how do you reconcile
the two? This is where the framework intervenes by providing us constant DEBUG
compilation and manipulation classes of debugging information.
Compilation constant DEBUG
What is a compilation constant? Just a small string that allows the compiler
to perform certain tasks in his presence or not. The C / C + + developers are
familiar with this principle by the famous pre-compilation directives #ifdef (It
is not dead in . NET and it is called # if CONSTANT# endif). This constant is
passed to the compiler by your favorite IDE by default in Debug mode.
The use of Debug and Trace classes
The Debug and Trace classes are two classes of the System.Diagnostics
namespace. They will allow you to record the activity of your application either
for debugging or for tracking production. What is the difference between the two
classes? The Debug class cannot be inherited. But why two classes then? This is
because of compile-time constants: the Debug class is active if the DEBUG
constant is defined as the Trace class is active if the TRACE constant is
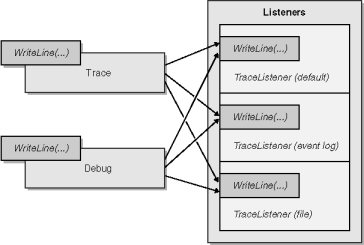
defined. Both these classes need to be provided for listeners. What are these
listeners? These are instances of class allowing to save the information that
you transmit to Debug and Trace classes. In fact, the Debug and Trace classes
simply relay the information to their listeners that record information. Why
such a system? It allows you to have multiple listeners and therefore, you can
save the information in several places at once.
Options common to all listeners
All listeners derive from a base class: TraceListener. This class exposes a
set of basic methods for managing listeners. IndentLevel property sets the
current level of indentation of the output of the receiver. Property Trace
OuputOptions defined output options of listeners for TraceSource class. These
options allow you to define automatic output that will be added to the output of
the listeners. You can automatically add the date (TraceOptions.DateTime), the
call stack (TraceOptions.CallTrace), or the number of process (TraceOptions.ProcessId).
For all options, see the documentation framework. These options can be added
cumulatively through a bitwise addition.
TextWriterTraceListener TextWriter = new TextWriterTraceListener ("trace.log");
/ / Add two bitwise output options textWriter.TraceOutputOptions =
TraceOptions.CallStack | TraceOptions.ProcessId;
Common functions
The listeners have three main methods allowing you to record events. The
Write and WriteLine methods allow you to write text in the listener. Fail method
allows you to raise an error message and display a dialog description standard
error
Different listeners of framework
-The TextWriterTraceListener
The first and simplest listener is the TextWriterTraceListener. This listener
allows you to record activities in a text file. We can declare and initializes
it as follows: TextWriterTraceListener debugTextListener = new TextTraceListener
("error.log"); This code allows you to create a log file named error.log.
-The ConsoleTraceListener
The listener ConsoleTraceListener allow us to display information on the
console.
ConsoleTraceListener console = new ConsoleTraceListener (true);
The Boolean value of the constructor allow us to specify whether we want to
use the standard error output (true) or not (false). By default this value is
true
- The EventLogTraceListener
This listener allows you to write in the Windows event log. The entries are
written in the Application log by default but nothing prevents you from creating
your own log in the log system of Windows.
-The WebPageTraceListener
This listener allows you to direct messages towards an ASP.NET page. It can
be used like any other listener with the only difference that it is located in
the System.Web namespace
Using Debug
All task of log in debugging is done through the static class Debug of the
System. Diagnostics namespace. See how to use it in order to create a log file.
using System.Diagnostics;
public class ClassDebug { public ClassesDebug () { Debug.Listeners.Add (new
TextWriterTraceListener (". / Debug.log")) / / Create a "listener" text output
to a text file Debug.AutoFlush = true / / is written directly, no delay.
Debug.WriteLine ("Constructor" + this.ToString ()); } }
And that's it! In fact, these few lines are enough to establish a monitoring
system in debug mode. At this point, you have configured a listener who will
take care to write in a log file all the information that you provide. But
nothing prevents you to send these information in multiple listeners. To do
this, we need to add a listener to Debug.
Debug.Listeners.Add (new EventLogTraceListener ("SuperApp"));
Well, now you have a tracking system events in your application for debugging
Follow your application to track
Trace class is exactly the same as the Debug class with the only difference
that it does when the application is compiled in debug mode and release mode.
Advanced methods of monitoring Event
Previously we have seen the basic use of the Debug and Trace classes. Indeed,
we simply write information without distinction as to the importance of the
error. We will now correct this oversight.
Using TraceSwitch
TraceSwitch class allows you to specify the level of information that we want
to write in the listener. In order to use it, we will change a little the way we
use the Debug and Trace classes by using WriteLineIf and not WriteLine.
Debug.WriteLineIf (condition, "MyText");
TraceSwitch class has four trace levels (in order of who should write at
least to those who must write more): Error, Warning, Info, Verbose. These four
levels allow you to choose the amount of information written on the basis of
need. The TraceSwitchs will be configured through the configuration file of the
application “NameProgram.exe.config." This method which is the simplest, and
especially the best, allow you to change easily the value of TraceSwitch and
therefore, in case of a problem, to get more information without having to
recompile the application.
<configuration> <system.diagnostics> <switches> <add name="MySwitch"
value="4"/> </ Switches> </ System.diagnostics> </ Configuration>
Extract configuration file above shows the configuration of a TraceSwitch
named MySwitch that is configured to write information in verbose mode (level
4). Level 0 (value = "0") disables TraceSwitch and nothing is written. Then
,levels 1, 2, 3 and 4 follow the order given above. To make the link between the
values of the configuration file and instance of TraceSwitch, you must respect
this simple rule: The "displayName" constructor's of TraceSwitch must be equal
to the value of property name of the configuration file. In the previous case,
we have:
TraceSwitch = new TraceSwitch ("MySwitch", "TraceSwitch test");
Debug.WriteLineIf (traceSwitch.TraceError, "Trace error"); Debug.WriteLineIf
(traceSwitch.TraceWarning, "Trace warning"); Debug.WriteLineIf
(traceSwitch.TraceInfo, "Trace info"); Debug.WriteLineIf
(traceSwitch.TraceVerbose, "Trace Verbose");
If you run the above example you will notice that with level 4 you get all
the messages. Indeed display levels are cumulative, which means that if you set
your TraceSwitch at Warning level ,messages of Error level will also be treated.
In the previous examples we have handled one TraceSwitch but nothing prevents us
from using more:
<configuration> <system.diagnostics> <switches> <add name="MySwitch"
value="4"/> <add name="MySwitch2" value="2" /> </ Switches> </
System.diagnostics> </ Configuration>
tS2 = new TraceSwitch ("MySwitch2", " TraceSwitch number 2");
Debug.WriteLineIf (tS2.TraceError, "Trace error 2"); Debug.WriteLineIf
(tS2.TraceVerbose, "Message not displayed by the TraceSwitch number 2");
Conclusion
 From a practical point of view what are the actions you, developers must
implement to have a proper management of logs? Firstly, when debugging you must
use the methods of Debug class. Indeed, these calls will not be present in the
release version and so it will allow you to write large amounts of information
without compromising the end user with slowdowns. Then you have, to the
important points of your application, used the Trace class methods combined with
TraceSwitch to obtain the level of information appropriate to the situation.
Therefore, by default, it is best to position the TraceSwitch to 1 in order to
have in the log file only errors that have occurred. If these errors intrigue
you, you can simply position the TraceSwitch to a higher value in order to get
more information. Judicious use of information levels of a TraceSwitch is an
important asset in managing your log files which will allow you to properly
prioritize the information on your application. In this perspective, it is
strongly recommended to set the TraceSwitchs in the configuration file of the
application and not in the code. It will allow you to have only one value to be
changed in a text file, rather than having to recompile the entire application
and then having to redeploy it. We can say that the framework allows us to
easily access, manage and use a system that can be complex. Classes provided by
the framework allow a lot of things that can be used with great flexibility. From a practical point of view what are the actions you, developers must
implement to have a proper management of logs? Firstly, when debugging you must
use the methods of Debug class. Indeed, these calls will not be present in the
release version and so it will allow you to write large amounts of information
without compromising the end user with slowdowns. Then you have, to the
important points of your application, used the Trace class methods combined with
TraceSwitch to obtain the level of information appropriate to the situation.
Therefore, by default, it is best to position the TraceSwitch to 1 in order to
have in the log file only errors that have occurred. If these errors intrigue
you, you can simply position the TraceSwitch to a higher value in order to get
more information. Judicious use of information levels of a TraceSwitch is an
important asset in managing your log files which will allow you to properly
prioritize the information on your application. In this perspective, it is
strongly recommended to set the TraceSwitchs in the configuration file of the
application and not in the code. It will allow you to have only one value to be
changed in a text file, rather than having to recompile the entire application
and then having to redeploy it. We can say that the framework allows us to
easily access, manage and use a system that can be complex. Classes provided by
the framework allow a lot of things that can be used with great flexibility.
Programming
Introduction to Java EE (Part 1)
How the Google App Engine Works
WSDL - Web Service Description Language
SOAP: Simple Object Access Protocol
Initiation to Cryptography and Encryption to Secure Data
Introduction to Design Patterns in Java
How To Write Efficient Programs in Java
Proper Management of Logs in .Net
How To Remove FaceBook Action Ids From URL |